Introduction
Investigators go through digital data from mobile devices that were found in crime scenes, in order to find the evidence they are looking for. This evidence is later on submitted to the court as a report. This report includes important visuals and tells the narrative of the investigation. To help them build this report we have created the “Report builder”. They can easily add data to the report, decide what appears and in what order, and remove data that isn’t relevant to the case.
My role: UI designer. | Tools used: Sketch, Illustrator, Photoshop. | This project was done as part of my work at Cellebrite.
My role: UI designer. | Tools used: Sketch, Illustrator, Photoshop. | This project was done as part of my work at Cellebrite.
The challenge
- Create a report that can be submitted as evidence in court, quickly and easily.
- Tell the narrative of the investigation and present the evidence to support it.
- Collaborate with your team members in creating the report.
Pain points
- Telling the narrative, so others can understand it easily.
- Explaining the evidences’ relevance and how it supports the case.
Gain points
- Helping you tell the narrative of the investigation - what happened before, after and during the crime.
- Saving the important data in one place, so it can be used later on to create the report.
- Assisting you in creating a simple report, so others can understand it easily.
- Allowing you to collaborate with your team members in creating the report.
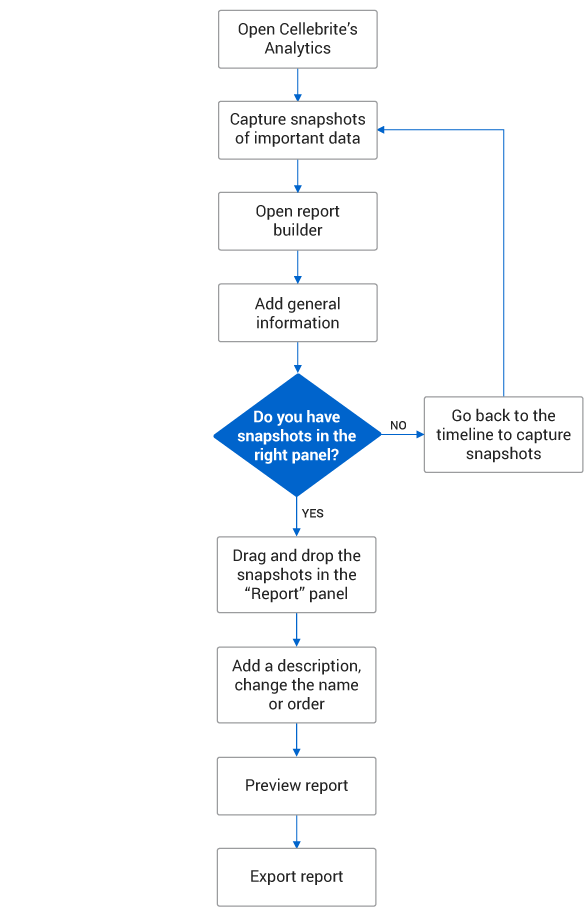
User flow
Personas
The user is an investigator who wants to find the relevant evidence and solve the crime.

Design
Scenario
Steve needs to create the "Downtown NY robbery" report that will be submitted to court.
General information
Steve opens the report builder, uploads the unit's logo and fills in the general information.
Steve opens the report builder, uploads the unit's logo and fills in the general information.
Drag and drop
Steve drags and drops a snapshot from the data elements panel to the report panel in the middle. He can edit the name, add a description or remove it. If the data elements panel is empty, Steve will need to go back to the timeline and capture snapshots of relevant data. These snapshots will appear in the data elements panel.
Steve drags and drops a snapshot from the data elements panel to the report panel in the middle. He can edit the name, add a description or remove it. If the data elements panel is empty, Steve will need to go back to the timeline and capture snapshots of relevant data. These snapshots will appear in the data elements panel.
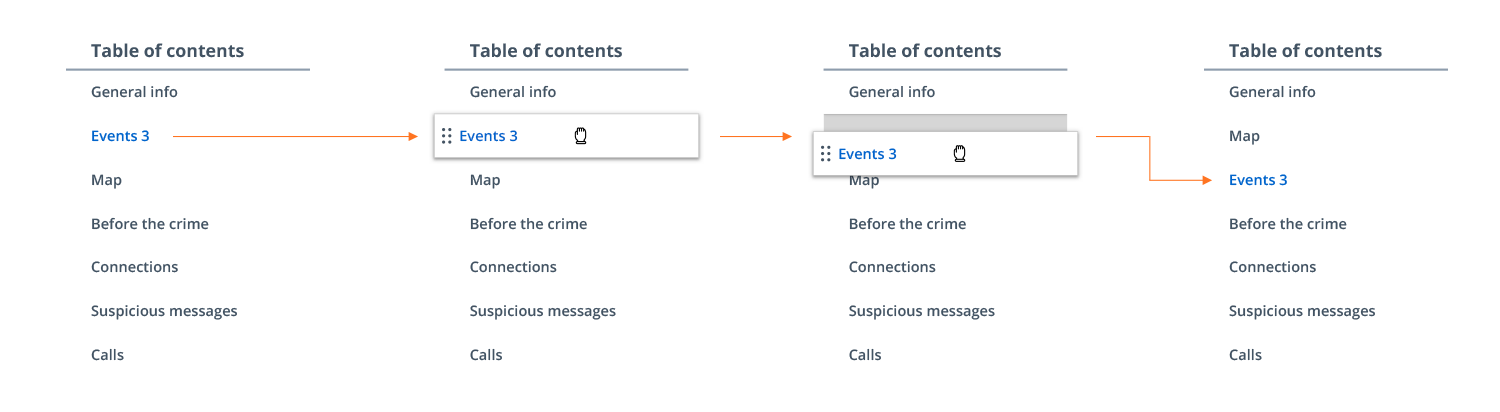
Table of contents
Steve can change the order of the snapshots by dragging the rows in the table of contents up and down. If he clicks on a row, the report panel in the middle will jump to that specific snapshot.
Steve can change the order of the snapshots by dragging the rows in the table of contents up and down. If he clicks on a row, the report panel in the middle will jump to that specific snapshot.
Preview and export report
When Steve is finished creating the report, he can preview and export it.
When Steve is finished creating the report, he can preview and export it.
Final thoughts
Each mobile device has enormous amounts of digital data. It’s hard to find the relevant data that will support your case, present your findings in a simple way so others can understand it easily, tell the narrative and convince the court the suspect is guilty. This project was very important because it allowed the investigators to do exactly that. Working on this project was very interesting and challenging. I needed to find a way to create a simple and intuitive tool, that keeps your focus on the evidence and the narrative. It’s as simple as drag and drop.
